Experiment: a course of action taken or adopted without being sure of the outcome?
I was born in 1951 in the Wirral on the banks of the River Mersey. I first lived in a council house or state housing on Love Lane. Near the old railway lane running from Bidston to Wallasey Seacombe.
At the bottom of love Lane there was railway cutting where my sister and me set watching the steam trains down below us. Some times the driver would blow his whistle at us and we both waved to him as he passed by. No one in Love lane owed a car or automobile.
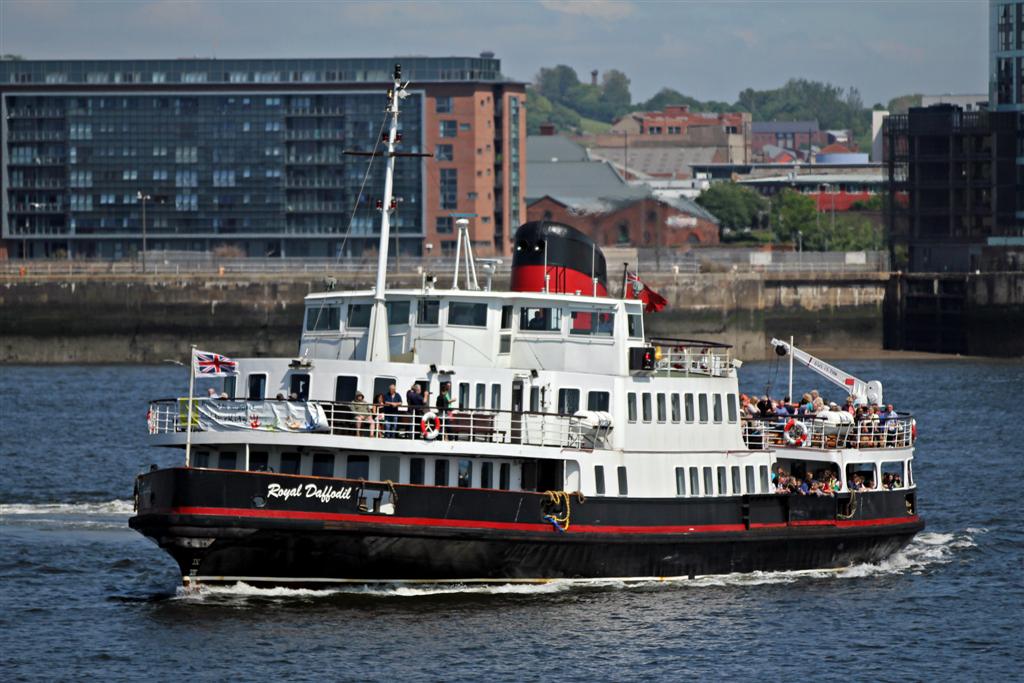
As kids we walked and later on when we bought our own bikes we cycled everywhere. Occasionally we’d got on a bus or even a train. Going to Liverpool we’d get the bus to Seacombe crossed the River Mersey on the Royal Daffodil steam ship to the pier head at Liverpool over the other side of the River Mersey. Sometimes we’d get on a electrical trolley bus from the pier head to Lord street the main shopping area. You might ask what’s an electrical trolley bus? Trolley bus had an pantograph to connect the trolley bus to overhead electrical live rails.

Town gas or coal gas as it was called came from the Birkenhead gas works that was produced by the following process; The original coal gas was produced by the coal gasification reaction, and thus the burnable component consisted of a roughly equal molecular mixture of carbon monoxide and hydrogen. Thus, coal gas was highly toxic. People in those days were able to commit suicide by sticking their heads in the gas oven.
Originally created as a by-product of the coking process, its use developed during the 19th and early 20th centuries tracking the industrial revolution and urbanization. By-products from the production process included coal tars and ammonia, which were important chemical feedstock for the dye and chemical industry with a wide range of artificial dyes being made from coal gas and coal tar.
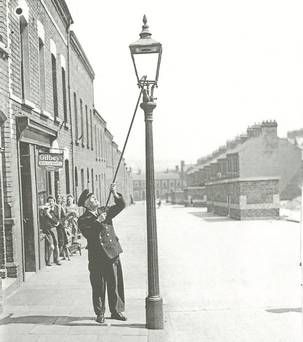
Facilities where the gas was produced were often known as a manufactured gas plant (MGP) or a gasworks. The street lights in 1950’s and 1960’s were town coal gas fired and the towns corporation guy with his long lighter stick went around wallasey on his bike to light them.
The discovery of large reserves of natural gas in the Southern North Sea off the coasts of Norfolk and Yorkshire in 1965 led to the expensive conversion or replacement of most of the UK’s gas cookers and gas heaters, except in Northern Ireland, from the late 1960s onwards.
When I was born in the 1950’s there were no dual carriageways or motorways in the U.K.
Car ownership in 1950 was for middle classes and the wealthy. There was about 4 million cars on the roads with a U.K. population of 50 million. World Oil production in 1950 4.2 million barrels.
At age 7 we moved to Liscard in Wallasey to a bought house in Trinity Road there were a few privately owned motor cars like the Mayflower and Ford classic the Ford popular and the Rover. But not many cars and in the 1960’s cars were still classed as expensive forms of transport.
People commuted by train, bus and ferry. When not using public transport they walked or cycled. I certainly did as wee boy I cycled every where. I walked to school everyday never collected by my mum from school. As children we were like street urchins. The world of Wallasey was our oyster!
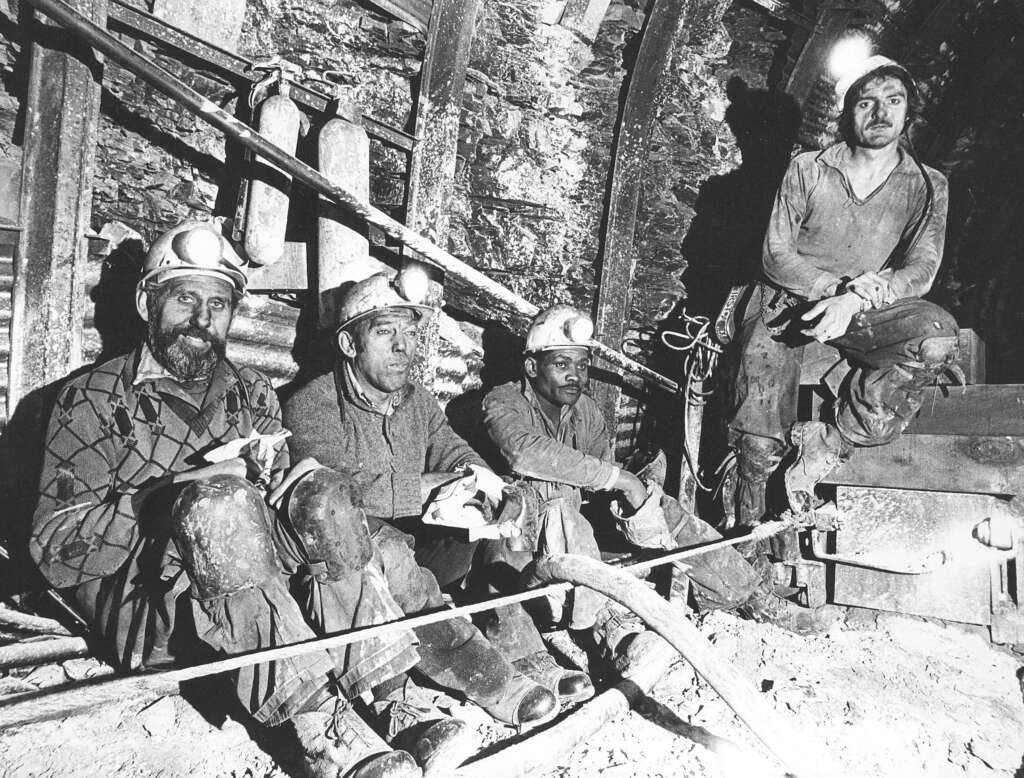
Coal production in the U.K. in 1960 the coal mining industry produced 177m tonnes of coal a year from deep mines and employed over 500,000 miners at 483 facilities. But coal was under threat as railways were cut back and moved to diesel and electric power.
Oil became the master of energy production followed by natural gas. 1970 oil production 9.6 barrel per day. After the extensive oil growth from 1960-73, ‘demand in the non-communist world more than doubled, from 19 million barrels/day to 44 million barrels per day.
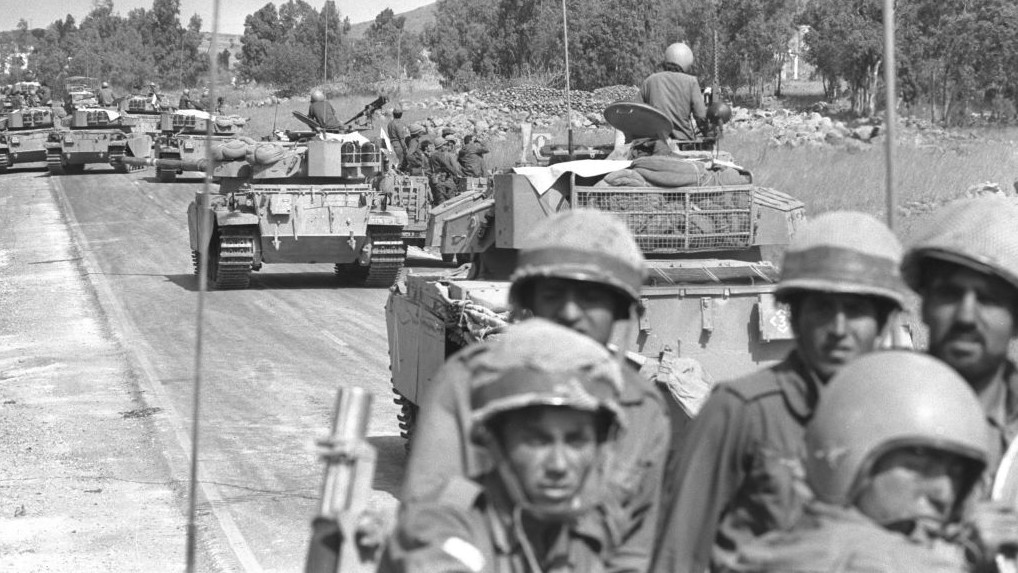
October 1973 sparked the first major oil crisis leading to a recession. On October 6th, the Jewish holy day of Yom Kippur, Egyptian forces attacked Israel from across the Suez Canal. Syrian troops flooded the Golan Heights in a surprise offensive. After early losses Israel (with US help) fought back reversing Arab gains and a ceasefire was called in November.
OPEC retaliated against US support. On October 17th, OPEC established an ‘Oil Embargo’ which lasted for about 6 months in which they reduced oil production by 25% (5% per month) exercising their collective strength against the western world almost bringing the west to a halt. US imports dropped from 6 million barrels in November 1973 to 5 million in a matter of months.
Prices tripled to $29.43 a barrel, because of OPEC’s oil production decrease because of the US support, which resulted in oil dependent nations in recession.
‘By 1976, world oil demand and OPEC production were back to 1973 levels’ but at significant costs speed limits and energy regulations were brought in to control oil consumption during this period.
The Yom Kippur War, also known as the Ramadan War, the October War, the 1973 Arab–Israeli War, or the Fourth Arab–Israeli War, was an armed conflict fought from 6 to 25 October 1973 between Israel and a coalition of Arab states led by Egypt and Syria.
In 1973 as a serving soldier I remember the OPEC oil crisis situation and industry went onto a 3 day working week. On motorways you were restricted to the driving speed limit of maximum of 50 mph. My training instructor a staff Sergeant on my combat engineering course in Tidworth lived on Merseyside. He gave me lift back to Tidworth camp near Salisbury after a weekends leave. We got stopped in his Ford Capri in the early hours of Sunday morning by the motorway police on the M4 and he was fined for speeding during the oil crisis.
By 1980 oil production was mainly dominated by the Iran oil crisis of the late 1970’s and all the way through to the late 1980’s.
Iran was led by Shah Mohammad Reza Pahiavi, the Shah of Iran who has non-fundamentalist and pro-western views.
Between 1953 and 1979, Iran was under US control. The US broke BP’s monopoly and oil shared between the seven sisters with most going to the US. This resulted in high amounts of civil unrest meaning that oil companies evacuated leaving crumbling oil infrastructure behind them. This led to hatred towards the Shah and has massive consequence on global oil production.
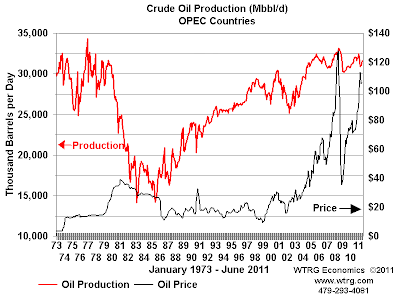
From figure 1, you can clearly see that the Iran-Iraq war of the 1980’s had a massive effect on production throughout that decade. In the early 1980s’ 2-2.5 million barrels of oil were being lost a day, which was again exacerbated by the start of the Iran-Iraq war, when the production per day decreased by almost 20 million barrels to a low in 1982/3 at just 13.5 million barrels per day.
Oil production was almost halted and there were again, rapid increases in oil prices, for the second decade running. Within a year, oil prices had doubled to $25 a barrel and peaking again in 1982 at $32 per barrel. Again, petrol rationing was needed as well as the White House installing solar panels on the roof.
Furthermore, the share of OPEC dropped from 55% of all the petroleum exported in the 1970s to 42% in 2000, with an all-time low of 30% in 1985′ (Rodrigue et al, 2009).
It then took 6 to 7 years for global energy prices to stabilise to the level which they were before the war and oil crisis/recession.
The current day for oil is roughly around 90 million barrels of oil a day to satisfy the world’s needs, ‘compared with 31.2 barrels in 1965’ (Rodrigue, 2009) International Energy Agency forecasts demand will be 121 million barrels a day by 2030. The demand for oil use is primarily for transportation; Road, sea and air.
The increasing growth for transportation leads to the increase growth in demand. Even though the currently average car per household is less than 1, because of so many people in Africa without, in more developed countries it is not uncommon for a family to have 2 or 3 cars, so now the race is on to Increase in powering vehicles by anything other than oil, the more the better. Oil companies have now changed tack and are going for a ‘just in time approach’ to oil production as the depletion of reserves are continuing.
The US dominates oil demand and consumption which stands at roughly 18 million barrels of oil a day, with China only at 8 million barrels per day (2010). The US is the powerhouse in terms of oil demand and consumption and out strips all the countries of Europe who demand almost 15 million barrels per day with the US having higher Gross Domestic Product (GDP) which has been closely linked with the consumption of oil and the reliance upon it for economic activity.
America, China, Russia and Saudi Arabia produce more than 1 billion barrels of oil per year. Middle East produces 50% of the world’s oil supply with Saudi Arabia producing 50% of that. The Middle East and Russia are net exporters of oil, whereas America and the West are net importers, the superpowers are all at the hands of the East. The UK is a net importer of crude oil, as the North Sea Oil is not of a decent enough quality for use as petrol.
In the 1980’s I had left the army and became a sales representative working in industrial sales with a company car first one being a small Ford estate car followed by Ford cortina and eventually the reps mainstay of that period the Vauxhall cavalier. All Petrol driven vehicles.
Like all others in the 1980’s we were all oblivious to climate heating but the oil extractors and refiners were well aware of the risk of atmospheric change caused as a by product of burnt fossilised fuels from the internal combustion engine. Exxon had done an in-depth study into carbon dioxide released through burnt fossil fuel petroleum products.
It stated categorically carbon dioxide would act as a greenhouse gas. What did they all do but use tactics like the tobacco industry, confuse, deny and muddy the waters about climate heating.
But the general public slowly became more aware of burning fossil oil based fuels being a problem with climate change.
In the 1820s in France, Jean Fourier was investigating the behaviour of heat when his calculations revealed that the earth should not be as warm as it is. That is, the earth is too small and too far from the sun for it to be as warm and livable as it is.
On its own, solar radiation is not enough. So what was warming the earth? As he pondered this question he came up with some suggestions. Among them is the idea that heat energy from the sun penetrates the earth’s atmosphere, and that some was not escaping back into space.
The warmed air, he suspected, must be acting as a kind of insulating blanket. He had described what now is commonly known as the Greenhouse Effect. Fourier was the first to do so.
In the 1820s, Fourier did not have the technology to make the measurements needed to explore his hypothesis. Decades later, the Victoria natural historian, John Tyndall, brought a fresh perspective to Fourier’s question and suggestion.
As an avid mountain climber, Tyndall observed evidence of climate-induced changes in ice caps, and he conducted experiments to measure the heat trapping propertities. This led to his discovery that water vapour and carbon dioxied are good at trapping heat.
Tyndall’s insights captured the interest of a Swedish scientist. Svante Arrhenius figured out that earth’s temperature is not regulated by water vapour because it recycles rapidly in and out of the atmosphere. Rather, he saw that carbon dioxide regulates temperature directly as it is a long-lived resident of the atmosphere that changes relatively slowly over time.
As Arrhenius explored these issues, he worked with his colleage Arvid Hogbom, a Swedish geologist who was studing natural carbon dioxide cycles. Hogbom had discovered that CO2 emissions from coal-burning factories were similar to emissions from some natural sources.
The two investigators asked what would happen if emissions from human sources increased and accumulated over centuries. Arrhenius calculated that doubling the concentration of CO2 in the atmosphere would raise the global average temperature by 5 to 6°C. His conclusion was challenged and not accepted. Confirmation would take decades.
In 1859, Tyndall showed that gases including carbon dioxide and water vapour can absorb heat. His heat source was not the Sun, but radiation from a copper cube containing boiling water. In modern terms, this was infrared radiation – just like that emanating from the Earth’s surface.
Previous work had shown that the Earth’s temperature was higher than expected, which was put down to the atmosphere acting as an insulator. But no-one knew the explanation for what we now call the greenhouse effect – gases in the atmosphere trapping heat.
What Tyndall did was to discover and explain this mechanism. He wrote: “Thus the atmosphere admits of the entrance of the solar heat; but checks its exit, and the result is a tendency to accumulate heat at the surface of the planet.”
He realised that any change in the amount of water vapour or carbon dioxide in the atmosphere could change the climate. His work therefore set a foundation for our understanding of climate change and meteorology.
Tyndall was not, however, the first to make the climate link. That prize goes to the American Eunice Foote, who showed in 1856 using sunlight that carbon dioxide could absorb heat. She suggested that an increase in carbon dioxide would result in a warmer planet.
Research suggests Tyndall was unaware of her work. He would no doubt have been surprised to find that an amateur woman had beaten him to a general demonstration of the absorption of heat by carbon dioxide. To his discredit, he did not believe that women possessed the same creative abilities in science as men.
Tyndall made many other discoveries in disparate fields of physics and biology. He made his initial reputation in the obscure topic of diamagnetism, the weak repulsion of substances by a magnet. That brought him to the notice of influential people such as physicist Michael Faraday.
Within a few years he was a fellow the Royal Society, Britain’s most prestigious scientific body, and professor of natural philosophy at the Royal Institution, where he remained for the rest of his scientific career.
Soon he was at work on understanding glacier structure and motion. After that came the work on the absorption of heat by gases, and then the action of light in causing chemical changes. In the process Tyndall explained why the sky is blue – blue light is scattered more by gases in the sky than other colours because of its short wavelength.
He also discovered “Tyndallisation” – a bacteriological technique of sterilisation – when undertaking experiments alongside French biologist Louis Pasteur to support the theory that germs can cause disease. That line of research led to the invention of a respirator for firefighters, though Tyndall never took out a patent. He committed himself to fundamental research, confident that others would generate useful applications.
When climate scientist Charles D. Keeling was born on April 20, 1928, carbon dioxide (CO2) was approximately 307 parts per million (ppm) and Earth’s global temperature averaged a whole degree cooler than it does today. Scientists had long established the foundation of climate science: adding enough CO2 to our atmosphere—such as through the combustion of fossil fuels—could drastically alter global temperatures. However, even after two industrial revolutions and World War I, many still couldn’t fathom a future where human activity could impact Earth’s climate.
Fast forward to the 1950s, when Keeling was a postdoctoral researcher at the California Institute of Technology. Scientists were beginning to develop a renewed interest in climate science as they began to observe a dramatic increase in the consumption of fossil fuels.
But there was no way to determine if this could result in the rise of CO2 in our atmosphere and, by extension, a shift in our climate. “Existing measurements suggested that atmospheric CO2 concentrations varied widely depending on place and time,” recalled Ralph Keeling, Charles’s son, years later. There was simply no way for a meaningful CO2 record to be established using available data.
But at the end of the 1950s, Charles Keeling developed a new method to accurately measure CO2—a technique he created out of necessity as part of a completely separate project. With his new method, he noticed that CO2 concentrations weren’t actually as variable as previously thought, assuming measurements were taken in remote areas away from the influence of human activity.
His work eventually drew enough attention and secured him enough funding to conduct continuous atmospheric measurements of CO2 at two locations: the Mauna Loa Observatory on the Big Island of Hawaii and another observatory located in the South Pole. Data collection began in 1958; CO2 levels now read 315 ppm. But it was still too early to establish a trend.
It wasn’t until the end of the 1960s, after fighting numerous budget cuts, that the data finally became clear. The Mauna Loa and South Pole CO2 records, which would together become known as the Keeling Curve, showed that the CO2 was undoubtedly rising—concentrations had increased to around 325 ppm. “The curve was seen by countless scientists,” remembered Ralph Keeling. “Some of whom were drawn to study the science of global warming by the curve’s obvious rise.
Charles Keeling was invited to present his findings at the American Philosophical Society in 1970. He ended his speech with an eerie warning: “[I]f present trends are any sign, mankind’s world…will be in greater immediate danger than it is today… If the human race survives into the twenty-first century…the people living then…may also face the threat of climatic change brought about by an uncontrolled increase in atmospheric CO2 from fossil fuels.”
When Keeling died in 2005, global CO2 levels had risen to 380 ppm. This year, on April 3, 2021, we surpassed 420 ppm for the first time in recorded history. These measurements were both taken at the Mauna Loa Observatory, Keeling’s legacy. Yet, sixty-three years after its establishment, human-induced climate change is still a topic of political debate—even though the science is settled.
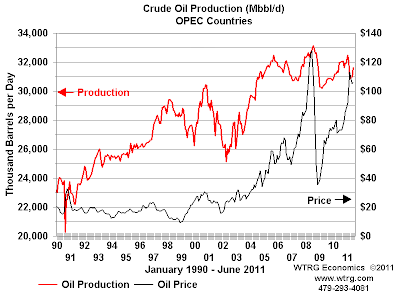
Now we again have a geopolitical oil problems with the war in Ukraine with Russian federation invasion. Causing oil prices to spike and liquid natural gas shortages with the Baltic Nordstrom’s pipeline being damaged through a terrorist act.
But let’s go back to when I was born CO2 in the atmosphere was about 315 ppm now the latest NASA level reported was 416 ppm. So in my life time carbon dioxide levels from the burning of all fossilised fuels: coal, natural gas and oil has increased by 100ppm this is highest it’s been identified by Ice cores in 400,000 years.
I keep a regular check on carbon dioxide levels in the atmosphere and all I ever see is year on year increases. So what are we going to do about it just keep talking and talking about it until there’s sudden and irreversible collapse in the living biosphere? Do you ever see politicians ever seriously talking about climate heating? Seriously? Here in the U.K. we’ve had two new prime ministers elected never once do I hear them talk about the most serious threat to mankind never other than lip service. We hear about balancing the books we hear about economic growth, growth and growth but never ever about the biosphere or the living planet 🌎 why? Oil industry lobbying and money interests, keeping the status quo!
So if the politicians aren’t going to do anything about it can we? Now we all know oil is geopolitical disaster through constant wars.
I think the best plans are kept simple on one full A4 piece of paper. Summary of what we need to do as a species to save ourselves. Maybe we’re too far gone for that in reality but maybe we need to still have a survival plan: And make no mistake this is the most serious threat to the biosphere and mankind! Period!
Reduce human world population
- Stop using cars or automobiles
- Walk or cycle
- Start building energy saving houses.
- Convert existing houses to reduce heat loss
- Stop using natural gas
- Convert to all electricity
- Set up local renewable infrastructure
- Move away from centralised energy generation
- Develop local energy committed to look at the latest ways to save energy.
- Look at wind, solar and geothermal
- Latest construction prefabricated low energy houses, that provide natural light and buildings that retain warmth for the winter and coolness for the summer.
- Develop more extensive cycle ways for traditional and electrical cycles
- Introduce modern electrical public transport systems that don’t require you to own a car or automobile.
- Develop cookers that are low energy consumption and fridges and devices that recirculate energy.
- Develop local heat and power energy systems that local people feel ownership of.
- Get people to learn how grow their own food and show them how stop wasting food.
- Wean them off the ownership of cars as status symbol.
- Force politicians to listen and understand the latest energy reducing buildings and devizes
- Get people to use less learn how they can become minimalists .
- Stop this idea of constant economic growth it’s totally unsustainable on a small finite planet!
https://www.goodwood.com/grr/road/news/2020/4/1955-vs.-2020–how-uk-roads-have-changed-in-65-years
Road Usage In 65 Years!
https://www.theguardian.com/environment/2022/oct/26/current-emissions-pledges-will-lead-to-catastrophic-climate-breakdown-says-Climate Breakdown